Performance Marketing
Every channel, one P&L.
Most brands run each channel in its own silo, judged by its own in-platform ROAS — a number that has every incentive to flatter itself. Meta counts a view-through conversion that Google also counts. DV360 credits an impression that never touched the eventual buyer. Add the platforms' self-reported numbers together and they routinely overstate what actually happened by 30–60%. Nobody set out to lie to you; every platform is just optimising its own attribution window to look as good as possible, and the sum of five flattering stories isn't the truth.
We stopped asking each channel to grade its own homework. Every account — Meta, Google, DV360, TikTok, YouTube — gets collapsed into a single portfolio view, attributed against revenue that actually landed in the bank, not revenue a pixel claims it influenced. That single view is what decides where the next rupee of budget goes, which means channels stop competing to look good in isolation and start getting judged on what they contributed on the margin.
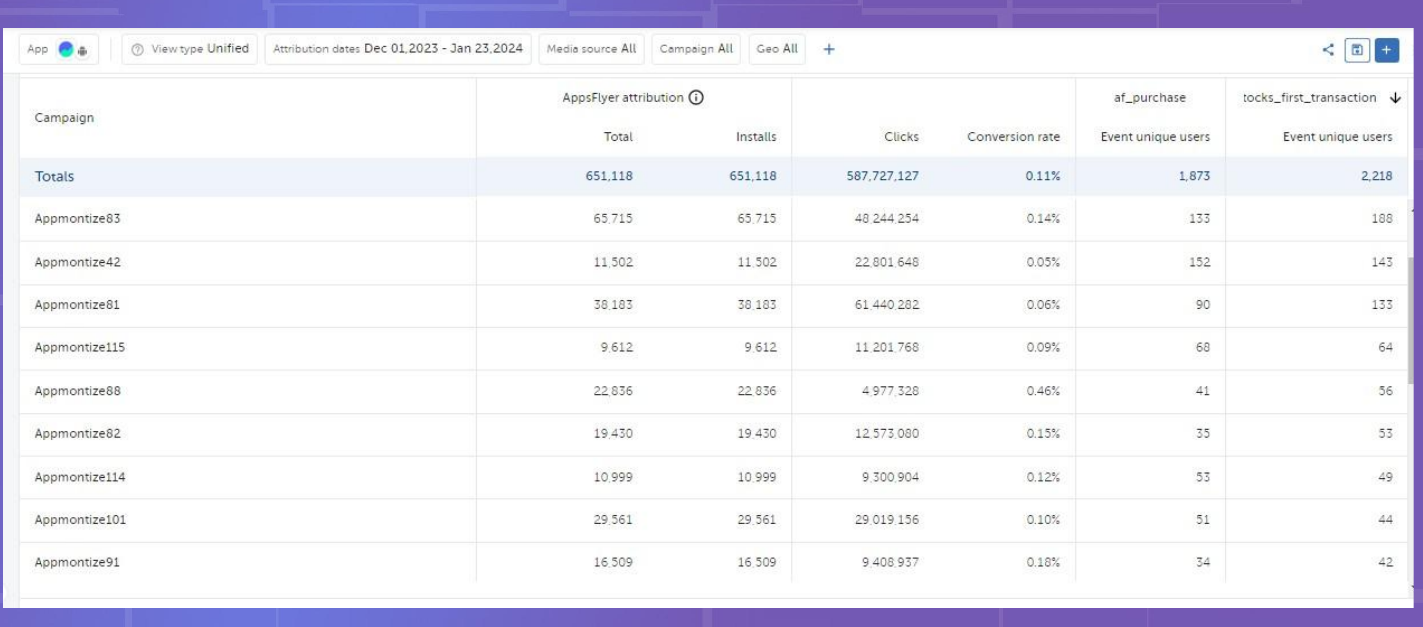
In practice that's a daily habit, not a one-time audit: pull server-side conversion data, reconcile it against CRM and revenue, re-run the incremental read, and move budget before the platforms' own dashboards have caught up. The channels that survive that scrutiny keep growing. The ones that were only ever winning the attribution argument, not the customer, get cut — usually within the first two weeks of taking an account over.
What's inside
Portfolio bidding
Budgets flow to incremental return across channels, not to whichever platform reports the prettiest in-app ROAS.
Daily attribution
Server-side + modelled conversions reconciled against your bank, not just the ad managers.
Creative loop
Winning angles get scaled, losers killed weekly — creative treated as the biggest lever, because it is.
Full transparency
You see the accounts, the spend, and the reasoning. No black-box retainers.